
Overview of the Development of Rapid Detection Technology for Highway Pavements
Sep 10, 2021
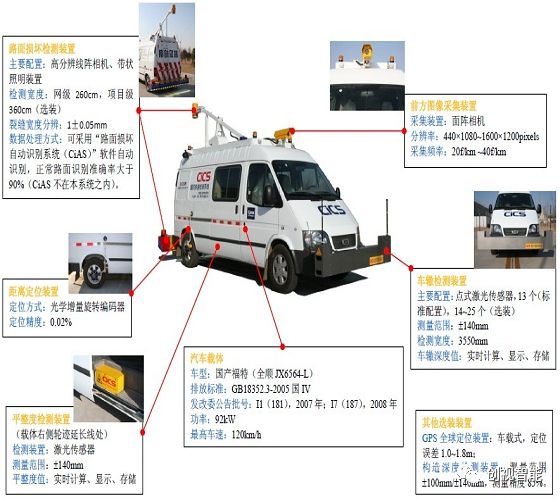
The Research and Development Center for Highway Maintenance Management at the Research Institute of Highway Sciences, Ministry of Transport, has developed a rapid road condition inspection vehicle (CiCS). Editor's note: "Road construction is development, and so is road maintenance." Scientific maintenance decisions and the allocation of maintenance funds require accurate data on the technical condition of roads, including pavement damage, lateral force, layer thickness, smoothness, rutting, texture, deflection, etc. Rapid pavement inspection technology needs to be able to continuously detect at normal traffic speeds, which helps to quickly and accurately obtain pavement condition indicators, providing a basis for maintenance decisions. There is not much difference between domestic and foreign technologies and products in terms of pavement inspection technology, and some of the existing technical routes and products are already leading foreign products. However, there is a significant gap in terms of leading technological development directions and sensor research. In the fields of pavement smoothness, rutting, and deflection detection technology, laser displacement sensors are indispensable key components. The use of high-frequency (such as 64kHz) laser distance sensors can measure longitudinal road profiles, which can also be used to measure pavement structure depth, pavement 3m moving standard deviation, and surface wear, significantly saving investment. At the same time, the road rutting detection technology based on the laser profile method requires the installation of at least 13 laser displacement sensors on a rigid crossbeam for measurement. This method can ensure a high sampling rate in the driving measurement direction using high-frequency laser distance sensors, obtaining almost continuous cross-sections, which is beneficial for calculating rutting length.
Abstract: According to the analysis of the 2013 Statistical Bulletin on the Development of Transportation Industry, the highway industry will gradually transition from a period of massive construction to a period of massive maintenance. The massive maintenance poses higher challenges to rapid road condition inspection technology and also provides significant opportunities for the development of rapid road condition inspection technology and changes in maintenance business models. Therefore, it is necessary to discuss the current status and development trends of rapid road condition inspection technology to provide technical support for large-scale maintenance inspections. A comprehensive summary of the current situation and research achievements of rapid road condition inspection technology both domestically and internationally has been conducted, explaining the rapid detection principles, technical routes, and implementation methods for road smoothness, rutting, damage, and deflection; focusing on the analysis of the advantages and disadvantages of different measurement technologies and their future development, summarizing and evaluating each technological route; introducing existing rapid road condition inspection products both domestically and internationally, and looking forward to the future development trends of rapid road condition inspection technology.
Keywords: Pavement; Rapid inspection; Laser dynamic deflection; Three-dimensional pavement
With the increase in traffic volume, as well as the effects of traffic loads and environmental factors, various diseases gradually appear on the pavement. Even some expressway asphalt pavements show early damage phenomena such as potholes, cracks, rutting, and insufficient surface function within 2-3 years of opening to traffic, significantly reducing the pavement performance and severely affecting the quality of use and service life of the pavement. This not only causes huge economic losses but also produces severe negative social impacts. The Ministry of Transport has proposed that "road construction is development, and so is road maintenance, and it is even more important development." After expressways are built, as long as maintenance management is timely and appropriate, and reasonable preventive maintenance measures are taken, the service life of the road can be extended. Practice has also proven that the understanding of "high-quality expressways, no need for maintenance" is extremely unscientific.
China has entered a period of prominent resource and environmental conflicts, and highway maintenance management is an important field for building a resource-conserving and environmentally friendly society. Therefore, it is necessary to comprehensively promote rapid road condition inspection, analysis, and decision support technologies, advance scientific decision-making in highway maintenance, and improve the scientific level of highway maintenance decisions and the efficiency of maintenance fund use to face new situations and challenges in highway maintenance management.
Scientific maintenance decisions and the allocation of maintenance funds require accurate data on the technical condition of roads, including pavement damage, lateral force, layer thickness, smoothness, rutting, texture, deflection, etc. Rapid road condition inspection technology helps to quickly and accurately obtain pavement condition indicators, providing a basis for maintenance decisions. Road condition rapid inspection requires continuous detection at normal traffic speeds. Currently, indicators such as pavement damage, smoothness, rutting, texture, and deflection have been able to be quickly and integrally detected under the same reference baseline. This article discusses the detection technology for indicators that can be integrally detected.
1. Rapid Road Condition Inspection Technology
According to the Industry Standard JTGH20-2007 "Highway Technical Condition Assessment Standard" of the People's Republic of China, the highway technical condition index includes four parts: pavement performance, subgrade technical condition, bridge and tunnel structure condition, and roadside facilities technical condition. The pavement is the core content of highway technical condition evaluation. In many countries abroad, pavement maintenance management accounts for more than 70% of the work, and only the technical indicators of the pavement can be rapidly, accurately, and automatically collected. Among the existing rapid inspection technologies both domestically and internationally, pavement damage, smoothness, rutting, structural strength, and skid resistance indicators can be rapidly inspected. Among them, the skid resistance indicator requires inspection while watering, making it impossible to integrate inspection with the other indicators. This article mainly discusses the rapid inspection technology for the integrable inspection of smoothness, rutting, pavement damage, and structural strength indicators.
1.1 Pavement Smoothness Inspection Technology
Pavement smoothness is an important indicator of pavement evaluation, affecting not only the comfort of drivers and passengers but also related to vehicle vibration, operating speed, tire friction and wear, and vehicle operating costs. It is an indicator involving people, vehicles, and roads. Pavement smoothness is also one of the pavement performance indicators. In 1960, AASHTO road tests showed that about 95% of pavement service performance comes from the smoothness of the road surface. Long-term pavement performance research shows that pavement smoothness, especially initial pavement smoothness, will significantly affect the service life of the pavement. Due to the complexity of pavement smoothness itself, there are various definitions of pavement smoothness from different perspectives. There is still no unified definition of pavement smoothness worldwide.
The "Highway Engineering Quality Inspection and Evaluation Standard" (JTGF80_1-2004) stipulates that the inspection of smoothness indicators for each structural layer of roads at all levels should be carried out using a three-meter straightedge and the maximum gap h (mm) of the pavement, the standard deviation σ (mm) of the smoothness meter, and the international roughness index IRI (inter_national roughness index, unit: m/km). The "Highway Subgrade Pavement Field Test Procedure" TJGE60-2008 fully explains the experimental methods for measuring smoothness using a three-meter straightedge (h), a continuous smoothness meter (σ), a vehicle-mounted bump accumulation meter (IRI), and a vehicle-mounted laser smoothness meter (IRI). The "Highway Technical Condition Assessment Standard" JTGH20-2007 requires that pavement smoothness should be inspected using rapid detection equipment, which can be combined with pavement damage and rutting inspection. For third and fourth-class roads where conditions are not suitable, pavement smoothness can be manually inspected using a three-meter straightedge. It is required that pavement smoothness inspection data should be stored long-term in units of 100m (manual inspection) or 20m (rapid inspection) and specifies that pavement smoothness should be evaluated using the pavement ride quality index (riding quality index, RQI).

In the formula, IRI represents the International Roughness Index (m/km); a0 is set to 0.026 for expressways and first-class highways, and 0.0185 for other grades of roads; a1 is set to 0.65 for expressways and first-class highways, and 0.58 for other grades of roads. The Pavement Ride Quality Index is directly related to the International Roughness Index (IRI). The World Bank proposed a comprehensive and systematic calculation model and method for IRI in 1982 during international roughness tests conducted in Brazil. Using a 1/4 vehicle model, driving at a speed of 80 km/h over a known section, the accumulated displacement of the suspension system over a certain distance is calculated as IRI. IRI is an evaluation index that combines the advantages of cross-sectional and dynamic roughness measurement methods, and is a dynamic variable obtained by calculating static elevation data with a mathematical model. IRI is correlated with the dynamic response of vehicle vibration, establishing a correlation with vehicle performance through the 1/4 vehicle model; it is directly related to the elevation profile of the road section, ensuring time stability of the results; it can be measured with widely used instruments, ensuring the validity of the results; it can be converted internationally, possessing transferability, and IRI has become a widely adopted roughness indicator internationally. Therefore, the results of the current widely used rapid measurement technology are directly calculated as IRI.
Domestically, widely used road measurement equipment all have the function of rapidly measuring pavement roughness and calculating IRI indicators. The technical approach is based on inertial reference measurement, namely the laser profile (multi-laser profiler, MLP) measurement method. The implementation plan is to use a regular car as the measurement platform, install multiple laser rangefinders and accelerometers on a rigid crossbeam, or install two laser rangefinders and accelerometers on the left and right along the wheel path between the front and rear wheels, ensuring that the rangefinders measure at least the left and right wheel paths. Combined with GPS/DMI positioning modules and a control computer, a measurement system is formed. Data from laser rangefinders, accelerometers, GPS, and DMI sensors are synchronously collected by a data acquisition card, with each set of measurement data containing the distance from the rangefinder to the ground (D), acceleration value (G), DMI, and GPS information. The rangefinder measures the actual distance from the rangefinder to the ground, which is the longitudinal slope data of the road. As the vehicle travels, there are jolts and other attitude changes that require elimination through secondary integration of the accelerometer; DMI data provides the actual mileage information and is used to calculate the measurement speed information, which is used to eliminate the adverse effects of speed changes such as acceleration, deceleration, and stopping during measurement; DMI combined with GPS provides the mileage information of the measurement data, used to maintain synchronization with other data such as ruts and pavement. Using the longitudinal slope information of the road measured, and adopting the standard IRI calculation method provided by the World Bank, the IRI value at custom intervals, such as 20 m, 25 m, 50 m, 100 m, etc., can be calculated. The IRI calculation formula is:

In this equation, RS represents the corrected slope of the ith measuring point in the specified road section area; n is the number of measuring points within the road section area (≥11 m, measuring point interval 0.25 m) for which the smoothness value is to be calculated. From equation (2), it is known that the minimum interval for IRI calculation must be greater than 10 m. In some practical applications, there is a desire for an IRI with a 10 m interval. However, according to the principle of IRI calculation, a 10 m IRI is meaningless. Generally, an average method is used to obtain it, rather than the actual IRI within 10 m.
Additionally, in measurement methods based on inertial reference, if high-frequency (such as 64kHz) laser distance sensors are used, the measured longitudinal profile data of the road can also be used to measure pavement texture depth, pavement 3 m moving mean square deviation, and pavement wear, significantly reducing investment.
Although existing equipment can meet the needs of rapid smoothness measurement, these devices are all designed and developed based on the detection conditions of high-grade highways. They almost all assume that continuous detection is carried out at high speeds and at a constant speed. With the increasing traffic congestion, non-constant speed conditions during detection will become common. Zhou Xiaoqing [4] verified the mathematical analytical formula derived from the typical wavelength of the road surface and obtained a relationship diagram between the International Roughness Index (IRI) and speed. Through analysis, it was found that the relationship between IRI and the measurement speed V is not a monotonic increase; its trend is related to the speed and the wavelength of the road unevenness, controlled by the vehicle's system natural vibration frequency. IRI forms resonance near the two system natural vibration frequencies of the 1/4 vehicle model (7.16 s-1 and 66.15 s-1), reaching a local maximum. To better adapt to actual traffic conditions, researching the impact of pavement roughness wavelength, measurement speed, and speed changes on the acceleration integral will help further improve the measurement method and data processing algorithms.
1.2 Pavement Rutting Detection Technology
Rutting is the permanent track left by vehicle wheels on the road surface after driving, and it is the main form of disease in asphalt pavement, usually caused by the plastic deformation of the asphalt layer and the underlying layers. Many highway agencies and researchers agree that pavement rutting leads to vehicle skidding and a decrease in anti-skid performance in wet weather, directly affecting driving safety [5]; pavement rutting is also an early sign of pavement disease [6], and a typical sign of pavement deterioration [7]. The "Highway Subgrade and Pavement Field Test Procedures" TJG E60-2008 stipulates: there are seven standard rutting models, and in actual measurement calculations, the seven models can be simplified into two major models, "W" and "U". The "W" model can be further divided into convex and concave types. For concave "W" and "U" types, parameters need to be defined, such as defining the difference between the highest point and the lowest point in the middle of the "W" as a certain constant, greater than this constant is a "W" type, otherwise a "U" type [8]. According to the procedural requirements, measure the road cross-section, determine the top reference line based on the cross-section, and the maximum distance from the reference line to the cross-section is the rutting value.
There are various technological approaches to rapid rutting measurement, and all have been widely used. The basic principle is to quickly measure the road cross-section and calculate the pavement rutting through the cross-section. Practice has proven that they can meet the requirements of engineering applications. Rapid rutting measurements all use ordinary cars as the measurement platform, integrating data acquisition computers, GPS/DMI positioning systems. The laser profile measurement method installs at least 13 laser distance measuring machines on a rigid crossbeam to measure the road cross-section, with the crossbeam placed in front of the carrier vehicle for measurement; the laser triangulation method uses linear structured light combined with an area array camera, installed at an angle on the rear of the carrier vehicle with a camera and a linear laser sensor; the three-dimensional camera combined with the laser measurement method has the same installation method as the laser triangulation method.
1) Laser Profiler Method
The laser profiler is a relatively common rutting measurement device used in China, utilizing at least 13 laser distance measuring sensors in the cross-section direction to measure the road cross-section. With the increase in the number of sensors n, the maximum error in rutting measurement decreases rapidly when n <21, and the attenuation slows down when n >33. Therefore, in general accuracy detection, at least n=21 should be selected to ensure that the maximum error in rutting does not exceed 5% [9,10], but the cost is high. The laser profile method uses a finite number of distance measuring sensors to measure discrete points to simulate the road cross-section. Due to measurement posture, driving, and other reasons, the simulated cross-section from the discrete points often differs from the actual road cross-section, unable to accurately measure the wave peaks and troughs of the rutting, resulting in the rutting depth measurement being lower than the actual result [11-13]. Simpson [13] found through experiments that the correlation between the rutting cross-section measured by a laser profiler consisting of 5 laser points and the level measurement is about 0.4. In addition, the measuring beam generally cannot exceed the width of the vehicle body, resulting in this method being unable to measure the full lane and full cross-section, which also leads to measurement errors. The high-frequency laser distance measuring sensors used in this method can ensure a high sampling rate in the driving measurement direction, obtaining almost continuous cross-sections, which is beneficial for calculating the rutting length. However, Hui Bing [2] believes that the same depth value may correspond to several different cross-section shapes, and therefore a single depth value cannot accurately reflect the impact of different types of rutting on the pavement structure, nor can it reflect the actual situation of the interaction between the pavement and vehicles, which is not conducive to the assessment and maintenance of rutting diseases. The measurement errors, incomplete cross-sections, insufficient width, and other defects of the laser profiler method will limit its continued promotion and use in future road maintenance management.
2) Laser Triangulation Method
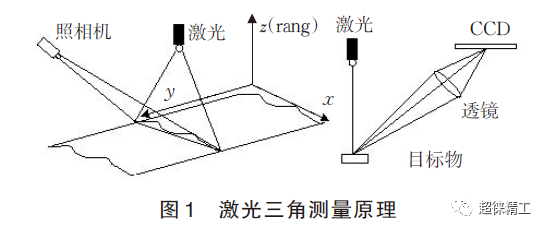
The laser triangulation rutting measurement method is the most widely used measurement method in domestic high-end equipment. Its technical principle is that the laser line is projected onto the road surface from one side at a certain angle, and the CCD camera (such as SICK, Basle, etc.) captures the road surface image from the other side at a certain angle. On the CCD, the laser line appears as a cross-section of the object being measured, as shown in Figure 1. If there is deformation on the object's surface, the laser line becomes a curve due to the deformation of the object's surface. By extracting the curve along the x-axis (width of the object) from the image, the row and column information of the curve in the image is obtained, with the column being the height in the image and the actual height in the physical world. Before measurement, the camera is calibrated to the pixel level, forming a pixel-level calibration table. Using the calibration table to convert image coordinates to physical coordinates, the actual coordinates corresponding to the curve can be directly calculated, thereby obtaining the road surface cross-section data, and then calculating the rutting.
The measurement accuracy of the laser triangulation method is affected by the relative relationship between the camera and the laser. Assuming the vertical height range calibrated for the camera is h, the angles between the line connecting the two ends of the camera center and the horizontal plane are α and β (angles α and β can be converted through the angles between the camera and laser with the horizontal plane), the camera's focal length is f, and the longitudinal resolution is m, then the actual height corresponding to each pixel can be calculated using the following formula:

Using CCD and linear structured light to obtain the width of road cross-sections can be adjusted as needed, allowing for full-lane and full-section measurements. Under existing technological conditions, the cross-section resolution can reach 1 mm. This method can accurately obtain road cross-sections, and the calculation accuracy of ruts is high. Given the limitations of the CCD camera frame rate, the minimum sampling interval in the driving measurement direction is between 5~10cm, which fully meets the needs of actual engineering. This measurement method is superior to laser profile measurement methods.
3) Three-dimensional cross-section method: Three-dimensional cameras (such as SICK's Ranger, AT's C3, etc.) combine laser measurement with the principle of laser triangulation. In terms of implementation, ordinary CCD camera measurements require the extraction of laser lines from the camera, and the cross-section is calculated through calibration. In contrast, three-dimensional cameras integrate the laser line extraction and calibration calculation process at the hardware level, directly outputting the cross-section. Since the integration is done at the hardware level, the measurement frequency of three-dimensional cameras is significantly better than that of ordinary CCD cameras. The latest data shows that the frame rate of three-dimensional cameras can reach 20kHz. Under conditions that meet the measurement range and lateral cross-section resolution, it can meet a sampling distance of 5 mm in the driving measurement direction at normal driving speeds. However, known three-dimensional cameras such as SICK's Ranger do not support programming [14], meaning that laser line extraction and cross-section calculation are already solidified in the sensor. In actual road measurements, lighting effects and environmental differences are significant. Experiments show that under conditions such as pavement heaving, rich markings, and strong light interference, the extracted cross-sections exhibit abnormal phenomena.
Although three-dimensional cameras still have certain limitations in use and have not been widely promoted in China, foreign companies and research institutions such as INO, TxDOT, etc., have begun to apply them in tunnel, highway, and rail inspection projects [15-17]. It is believed that with the development of three-dimensional camera technology, three-dimensional measurement is the main direction for the future development of rut measurement and even road inspection.
1.3 Pavement damage detection technology
The "Highway Technical Condition Assessment Standard" JTGH20-2007 stipulates: Pavement damage detection includes asphalt pavement, cement concrete pavement, and gravel pavement. The definitions of damage types for different pavement types are different. For example, asphalt pavement includes cracks, repairs, potholes, subsidence, bumps, loose, oil bleeding, etc., while cement pavement includes broken slabs, cracks, corner fractures, repairs, exposed aggregate, etc. Currently widely used pavement rapid damage detection technologies are all aimed at visual damage types rather than deformation-type diseases. The products basically use image systems to obtain pavement images and then use two-dimensional grayscale information processing technology to analyze pavement cracks [18], quantitatively analyzing pavement damage conditions.
The pavement damage detection system is installed at the rear of the measuring vehicle platform. The acquisition hardware consists of CCD line scan cameras (such as Dalsa) or area array industrial cameras, with auxiliary lighting using line lasers, shadowless lights, LEDs, or flashlights. The camera can use a general RJ45 interface or CameraLink interface and can choose cameras with different frequencies according to measurement environment requirements. For example, if a line scan camera is required to work at 120km/h, a 36kHz camera should be selected. During acquisition, the camera works in external trigger mode, and the DMI provides an external trigger signal for the camera. The collected data is saved in the server.
Cracks are one of the most significant forms of pavement damage, and crack identification generally uses a human-computer interaction method. To facilitate visual observation of crack damage, cracks should be as prominent as possible in the collected pavement images. The existing mainstream products have adopted a method of cross-illumination, that is, the pavement image system selects two 2048-pixel or higher-resolution line scan cameras and two high-power line lasers to work. The left laser illuminates for the right camera, while the right laser illuminates for the left camera. In this mode, the laser forms a certain angle with the pavement. When there is a crack in the pavement and it has a certain depth, the light irradiation will produce shadows within the crack. The grayscale value of the crack data in the obtained image will be significantly lower than the background, making the feature prominent and easy for the human eye to recognize, and also providing favorable information for subsequent automatic identification.
Currently, the mainstream equipment for pavement damage collection both domestically and internationally basically adopts the method of line scan cameras combined with line lasers. Generally, an infrared 808nm laser is selected, and cameras with spectral characteristics that meet this range are chosen accordingly. The resolution of the collected images is generally 1 mm. In terms of auxiliary lighting equipment selection, shadowless lights can also meet the lighting needs of line scan cameras, but shadowless lights are complex in structure, have high power consumption, and are inconvenient for installation and maintenance. They are prone to damage at high speeds and cannot meet engineering needs; LEDs have difficulties in power consumption and heat dissipation and cannot meet the requirements. An array camera combined with a high-frequency flash is another pavement image acquisition technology, but flashlights have high power consumption and significant safety hazards, and are less used in actual engineering.
The ultimate goal of pavement damage detection is to obtain pavement damage data. Regardless of the method used, the essence obtained is pavement image data. How to extract pavement diseases from image data is a core issue. The "Highway Technical Condition Assessment Standard" JTGH20-2007 stipulates that the detection equipment should be able to distinguish pavement cracks above 1 mm. The detection results should preferably use computer-automated identification, and the recognition accuracy should reach 90% or more. However, through a large number of engineering practices, it has been proven that the resolution of 1 mm cracks is closely related to the cause, shape, and data acquisition environment of the cracks, and cannot guarantee accurate identification of 1 mm cracks in any situation. As for the problem of automatic identification, it may be a difficult problem worldwide. So far, no data shows the existence of an algorithm or software that can adapt to any data collected under any circumstances, and the automatic recognition rate can reach 90% or more. Data processing is still mainly manual. According to some conference materials or product promotional materials, for the current two-dimensional pavement image disease identification problem, the most feasible solution may be to adopt the concept of classification before recognition [19]. By quickly dividing the pavement images into two categories: definitely no disease or possibly diseased, ensuring accurate detection of no-disease images, thus data processors only need to focus on possibly diseased images, thereby improving processing efficiency.
1.4 Rapid Deflection Testing Technology
The deflection value of pavement is an important parameter that characterizes the overall strength of road subgrade and pavement, reflecting the overall strength and stiffness of each structural layer of the pavement and the subgrade, and also directly reflecting the performance of the pavement. It is an important reference index for pavement design, acceptance, and maintenance. The measurement results can be used to assess the bearing capacity of the road and predict the remaining service life of the road. Therefore, it is particularly important to inspect the pavement structure. The "Highway Engineering Quality Inspection and Evaluation Standards" (JTGF80-1-2004) stipulates that China uses three measurement methods for road deflection: the Benkelman Beam, automatic deflection device, and falling weight deflectometer, which measure static rebound deflection, total deflection, and dynamic deflection, respectively. The Benkelman Beam has been used as the standard method and basic parameter for pavement design in China, and the measurement results of other methods need to be converted into static rebound deflection. The "Field Test Procedures for Highway Subgrade and Pavement" TJE60-2008 stipulates that deflection measurement is carried out by sampling, with the inspection mileage controlled within 20% of the maintenance mileage, and the amount of inspection data not less than 20 points/(km lane). These measurement and testing methods have obvious shortcomings: ① Low measurement efficiency. If one measurement point is measured every 20 meters, the measurement speed can only reach 3~5km/h, which cannot meet the needs of network-level deflection measurement; ② Poor safety. These devices are all stop-and-go measurement modes, especially when measuring on expressways, it is easy to have safety accidents. ③ Large traffic impact. During measurement, traffic control is required. ④ The measurement results cannot meet the evaluation needs of existing roads. The static sampling measurement method cannot simulate the pavement deflection generated by variable-speed moving loads under normal traffic conditions, and the measurement results do not reflect the actual dynamic characteristics of vehicle operation. At the same time, the deflection values of a limited number of discrete points cannot truly represent the deflection of the entire road[20].
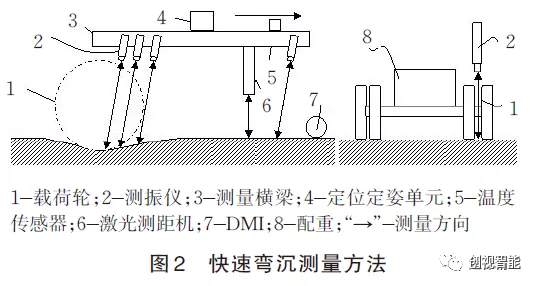
Rapid deflection measurement technology uses heavy trucks as the measurement platform, with the rear axle weight reaching 100kN through counterweight, and the measurement deflection basin is not less than 4 m, requiring normal measurement within the normal traffic speed range of 20~90 km/h. Internationally, rapid deflection measurement technology has two technical approaches based on traditional "force-displacement" distance measurement methods and indirect measurement methods based on pavement deformation speed. The measurement method based on distance measurement measures the displacement of the same point or section under load/no-load conditions by continuous measurement to calculate the deflection; the measurement method based on pavement deformation speed measures the deformation speed of the pavement under dynamic load and inverses the pavement deflection. The basic principle is that the first derivative of displacement is the deflection slope[21], and the deflection slope is defined as the ratio of pavement deformation speed to vehicle speed, so the pavement deflection can be converted by measuring the pavement deformation speed. Experiments show that the distance-based technology requires multiple sampling for each measurement due to the influence of measurement speed, pavement curvature, etc., while the deformation speed-based measurement method only requires one sampling for each measurement, which is suitable for high-speed measurement.
The deflection measurement method based on pavement deformation speed is based on the theory of elastic foundation beam[22] (beam on elastic foundation, BOEF), which simplifies the pavement structure layer (including surface layer, base layer, and cushion layer) into an infinite long beam on an elastic foundation, transforming the measurement of pavement deflection into the measurement of beam deflection. The deflection calculation formula is shown in Table 1.
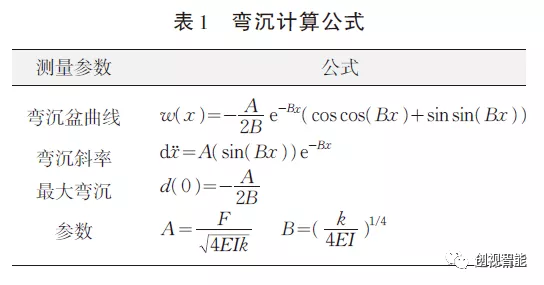
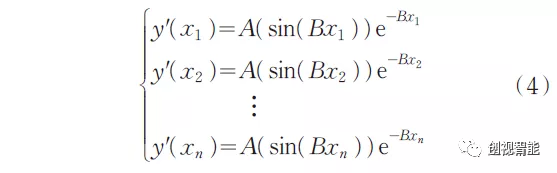
In Table 1, parameters A and B are related to the load force F, subgrade bed coefficient k, pavement stiffness modulus E, the position x where calculation or measurement is to be made, and the pavement rotational inertia I. In practical calculations, a system of equations can be established to avoid independently obtaining each parameter. By setting up the system of equations (4), parameters A and B can be solved, and subsequently, the deflection can be calculated.
As shown in Figure 2, the rapid deflection measurement system consists of a towing truck and a trailer. The trailer's rear axle has a weight of 100 kN, and on the trailer, a 4-meter-long rigid beam is installed. On the beam, various measurement sensors such as a Doppler vibrometer (Polytec), IMU, laser rangefinder, and infrared thermometer are mounted. The Doppler sensor measures the speed of pavement deformation, the IMU measures the pitch, roll, and yaw rates of the beam, and a high-precision GPS/DMI measures the vehicle's travel speed and performs positioning. The Doppler sensors are mounted on the rigid beam to ensure that the motion of the four Doppler sensors remains synchronized without relative movement. The installation of the four Doppler sensors should be as parallel as possible, located at 100mm, 300mm, 750mm, and 3600mm respectively. The sensor at 3600mm is used for reference measurement, while the other three are used for measuring the deformation speed within the actual deflection basin.
Recent Posts

October 26, 2016
The Most Successful Engineering Contractor

Oct 11, 2024
Shanghai Vision Expo | Highlights of TronSight


Oct 17, 2023
20 Trends in Sensors Over the Next Few Years
Contact US
Product Information
Quantity
Unit
Piece
Support order samples, customization, wholesale direct, and complete payment. If the product you look for does not have corresponding customized content, pls fill out the form below to contact us, and we will reply ASAP.