
【Industry Application】Online Measurement of Surface Roughness of Parts Based on Laser Triangulation Method
Apr 27, 2022
Abstract: This paper introduces a laser online measurement method for the surface roughness of parts, which has the advantages of fast measurement speed and the ability to display the specific morphology of the measured surface. The method introduces a laser triangulation system, using a non-diffracting laser beam as the light source and a high-precision camera as the displacement sensor. Through computer data processing, the surface roughness value is obtained, making online detection of surface roughness possible.
Keywords: Surface roughness; He-Ne laser; Camera; Laser triangulation
1 Introduction
Surface roughness error, also known as micro-geometric shape error, is a major geometric accuracy indicator for mechanical parts, which directly affects the performance and service life of machines or instruments. At present, in production sites, it is mainly estimated by visual inspection or tactile comparison with reference samples, while in the measurement room, the commonly used methods include the stylus method (Talysurf), optical section microscope, interference microscope, and electric profilometer. Due to their structure and performance limitations, it is difficult to achieve active measurement on-site, and the work efficiency is not high. The laser measurement of surface roughness introduced in this paper is based on the laser triangulation system and has undergone microcomputerization of the JSG-T optical section microscope. The image extraction system is modified at the original camera position of the microscope, using a digital camera to capture images, which are then input into the computer for data processing, calculating the surface roughness parameters, achieving automation of image extraction and data processing. This measurement method has the advantages of online measurement, not scratching the measured part, and being able to display the specific morphology of the measured surface.
2 Measurement Principle
The system uses a laser as the light source, and a convex lens, pinhole, and lens form a beam expansion collimation system. The beam fills the entire aperture of the conical lens, and the non-diffracting light beam formed behind is the incident beam of the triangulation system. During the measurement process, the light source (incident light), lens, and charge-coupled sensor are fixed, allowing the test sample to rotate uniformly along the axis. As shown in Figure 1, when the incident light beam irradiates a point on the test sample at an angle, due to the certain roughness of the sample surface, diffuse reflection will occur, and at this time, some of the reflected light will be focused on the sensor point through the microscope. The sensor will emit a signal, recording the position of the light spot at this time. If the reflected light does not change when the test sample rotates, the charge-coupled sensor's light spot also remains unchanged. When there is a microscopic unevenness on the surface of the sample (see Figure 1), the incident light beam irradiates point B, and the reflected light, through the lens, converges at the upper point. A signal is emitted, recording the position of the light spot at this time. Through computer processing, the surface roughness value of the sample can be obtained.
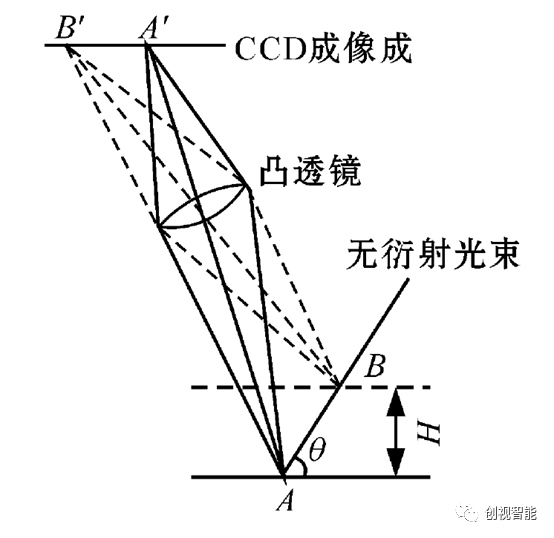
Figure 1 Principle diagram of laser triangulation
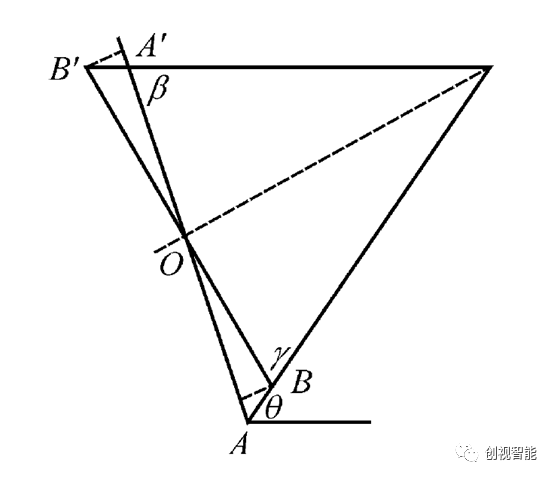
Figure 2 Laser Triangulation Analysis Diagram
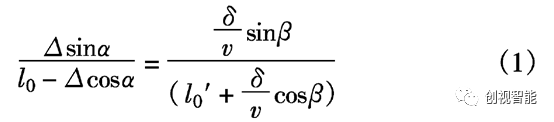
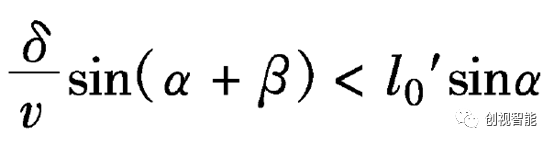
Let AB = Δ (delta), A'B' = δ (delta prime), and v be the magnification of the objective lens, then there is a relationship (or equation) that can be expressed:
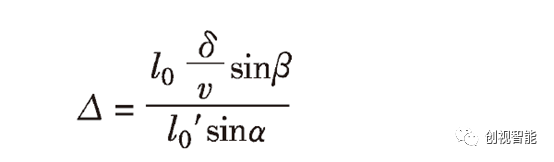
Thus, it can be concluded that:
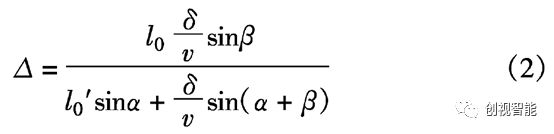
When Δ is very small,
There is,
Since the angle of the incident beam (i.e., the object plane) with the horizontal plane is θ, let the depth of the microscopic unevenness be H, then:
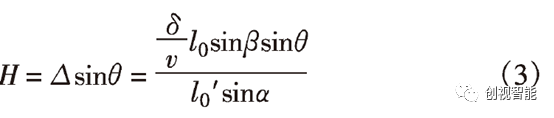
When α, β, θ, l0, and l0', v are all constants, equation (3) can be expressed as H = Kδ, where K is a constant, so H and δ are approximately linearly related. δ can be measured by a camera, and thus the depth of micro-unevenness H can also be calculated.
3 Measurement System
The measurement system, as shown in Figure 3, uses a CCD camera in the observation direction. A laser with a wavelength of 632.8nm is reflected from the surface being measured, passes through a microscope, and forms an image on the camera. The image is then inputted into an image acquisition card connected to a computer for image processing. The monitor displays the dynamic surface conditions, facilitating the selection of acquisition points. During the measurement process, by simply adjusting the initial light intensity, the roughness value Ra can be measured without changing the wavelength, incident angle, or focal length. This ensures that the test sample rotates uniformly around its axis. By capturing transient images and processing them with a computer, Ra can be obtained. Therefore, this method can be used for real-time measurement of surface roughness. In this process, the laser is imaged on the sensor after passing through the microscope. Then, image processing software is used to process the image files as necessary, such as sharpening, enhancement, edge detection, and extraction. This allows for the determination of the surface roughness profile and the calculation of the micro-depth of unevenness on the part surface. The corresponding surface roughness curve is obtained from the imaging points on the camera after passing through the microscope. The data processing to the surface roughness curve is completed by the computer.
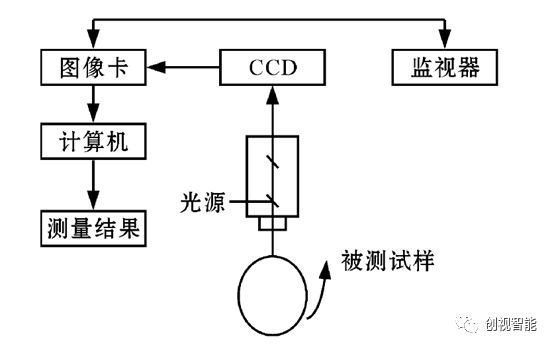
Figure 3 Measurement System
4 Comparison of Testing Accuracy
In this system, the JSG-T light-section microscope is selected, which has lenses with different magnification levels. For different magnification lenses, it is necessary to calibrate the system accordingly. Figure 4 shows the image obtained under a 14x light-section microscope of a 0.1mm step formed by a standard gauge block. After image processing and boundary extraction, the vertical pixel difference between the top and bottom lines is 146 pixels. Therefore, at 14x magnification, one pixel corresponds to a distance of d = 1/1460mm = 0.685µm. When the number of pixels between the rough peak and valley is N, then the distance between the peak and valley h = Nd (µm). For other lenses, such as 30x and 60x, simply multiply by the relative change rate of the magnification multiple.
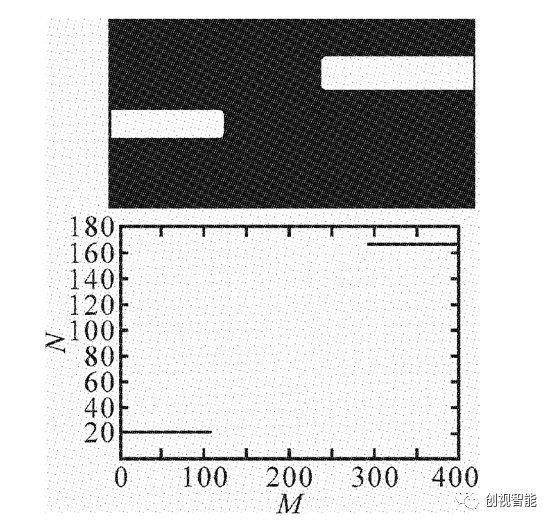
Figure 4 Image of a 0.1mm step under a light section microscope
Figure 5 shows the magnified surface image of a turned workpiece observed under a 20x stereo microscope, where uniform turning marks can be seen. Figure 6 is the surface profile obtained using the stylus method (Talysurf). Figure 7a is the image obtained with our system, and Figure 7b is the contour image after processing by our system. Comparing Figure 6 and Figure 7b, it can be seen that the surface topography profiles obtained by the two methods are very similar in shape and amplitude. The roughness statistical values obtained by both methods, as shown in Table 1, are also similar.
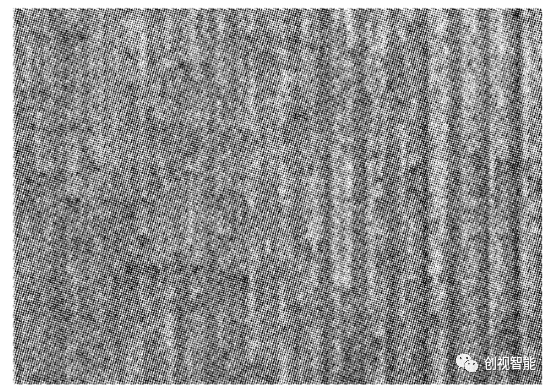
Figure 5 Turning Process Surface
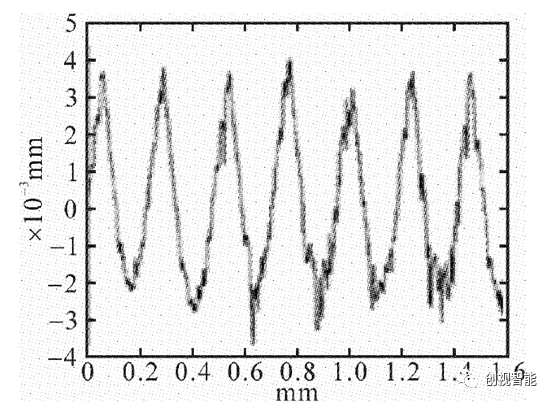
Figure 6 Surface profile measured by the stylus method
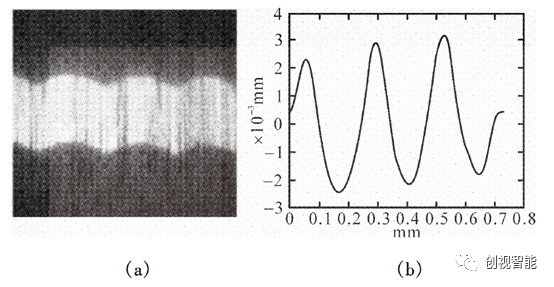
Figure 7 Surface profile of turning measured by this system
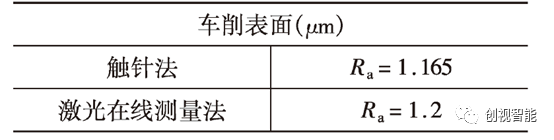
Table 1 Comparison of Roughness Values Obtained by Two Measurement Methods
5 Conclusion
The measurement system introduced in this article utilizes a non-diffracting laser as the light source, which has a small central spot and a resolution of 1µm. As a displacement sensor, the CCD has a wide spectral response range, can measure in real-time continuously, and can very intuitively reflect the surface roughness profile. The results are processed by a computer, allowing for faster and more accurate determination of surface roughness values. With the rapid development of modern manufacturing, the study of surface roughness has become a hot topic in recent years. Laser measurement methods, due to their fast measurement speed, high precision, and ability to reflect surface roughness profiles and support online measurements, have a promising future.
References
[1] Li Zhu, Xu Zhengao, Jiang Xiangqian. Interchangeability and Measurement Technology [M]. Higher Education Press, 2004:217.
[2] Zhou Liping, Zhao Bin, Li Zhu. Application and Research of Non-diffracting Beams in Laser Triangulation Measurement Systems [J]. Laser Technology, 1998, 22(1):22-25.
[3] Chen Liaojun, Liang Ping. Digital Transformation of Optical Section Microscope Image Extraction System [J]. Tool Technology, 2003, 37(9):48-50.
[4] Hu Shuguang. Sensor Design Based on Laser Triangulation Method [J]. Measurement and Control Technology, 2006, 25(6):7-8.

.jpg?x-oss-process=image/resize,w_100/quality,q_100)
Recent Posts


Contact US
Product Information
Quantity
Unit
Piece
Support order samples, customization, wholesale direct, and complete payment. If the product you look for does not have corresponding customized content, pls fill out the form below to contact us, and we will reply ASAP.